A more efficient fundraising strategy means you will spend less, raise more, and direct more of those fundraising dollars toward your mission.
There’s always more to do to support your cause. So don’t stop when you hit your goals and feel that sense of accomplishment.
So, start with the questions you want answers to and build reports that help you find them. These questions will help you set up and optimize your distribution lists so you can capture the data you need to improve your results.
And remember, your data is a lot more than numbers on a spreadsheet. Focusing on the right data points for your organization will take you beyond a report card that summarizes results. Your reports should provide key insights into how to refine and adjust your approach continually.
So, are you at a loss as to what questions you should ask? Or maybe you’re shocked to learn that optimization starts at the beginning of a campaign.
Either way, don’t sweat it! This blog will teach you what you need to know to assess your approach and increase your fundraising potential.
Who is the most responsive?
We want to look at two key areas when determining who is the most responsive.
First, we’ll look back to our section on prioritization. As we discussed, you should dig into your reports on response rate, average gift size, and total number of donations to determine which donors to prioritize. This will help you determine where most of your fundraising dollars are coming from so you can prioritize these highly responsive donors.
So, look into your audience segments like, active or lapsed donors, volunteers, donors by last gift date, and lifetime giving history, even if they have an active email on file or not. Then, take note of any specific traits donors in these groups share with one another and prioritize other donors in your audience who share these attributes.
LEARN MORE: Prioritizing donors who are most likely to respond.

Am I asking the right amount?
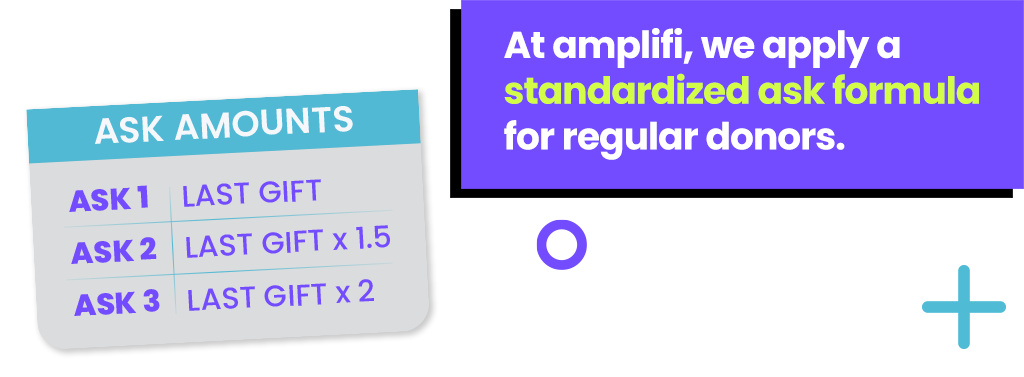
A poorly planned ask string can doom even the most well-planned and executed appeal. You can put in the work, but you won’t know if you’re making the right adjustments if your ask strategy is lacking.
They can give below ASK 1, at ASK 1, above ASK 1, at ASK 2, above ASK 2, at ASK 3, and above ASK 3.
So, you’ll need to look closely at how donors respond to determine if you should be more or less aggressive with your ask strategy. Our client benchmark is 30 percent of donors to give above ASK 1, while 20 percent give less than ASK 1. If you find yourself well above or below these numbers, it’s time to adjust!
You can take this to the next level by looking at your priority attributes and creating more targeted asks for specific groups. Then, look at your other audience segments and determine the right ask strategy for each.
LEARN MORE: 3 ways to raise more with your nonprofit’s ask string.

Are donors increasing their giving?
It’s important to determine if an individual donor has increased their support. This will help you adjust your ask strategy and subtly encourage donors to give more.
Determine a donor’s average gift size over a given time frame and compare that with their most recent gift and a donation they made last year. If a donor’s most recent gift was less than their average donation or last year’s, you’ll need to focus on increasing their support.
Look into your attributes again to determine if there are similarities between which donors are increasing their support. Then, reach out with targeted messages and asks to increase their giving.
LEARN MORE: How to increase support from mid-level donors.

Do donors give from my emails?
You’ll need to look at more than your click rate to determine if your donors are giving in response to your emails. It’s important to take the next step and look at your email conversion rate to understand why people are donating because of your emails, or not.
But the problem might be with your donation page, not your emails themselves if the clicks are there. So, you’ll need to calculate your online conversion rate (visitors to your website / number of donations) to see if something about your landing page stops recipients from donating.
According to the M+R Benchmarks 2024 Study, nonprofits’ average main donation page conversion rate is 12 percent. So, you’ll have some work to do if your average is less.
LEARN MORE: 4 ways nonprofits use data to optimize email outreach.
Test, analyze, refine (over and over).
If we haven’t said it enough already, you should always be looking for ways to improve your results and raise more money. Let’s face it. Your nonprofit is working to solve a complex problem in the world. And while our work certainly makes a difference, there is always more to do.
Unless you’ve already solved world hunger, that is!
As a fundraiser, your job is never done. So, you’ll always need to look ahead at what comes next.
Stay diligent about collecting and maintaining your data. Everything you learn during a campaign can be used to improve the next. When you come across a question you don’t know the answer to, dig deeper into your data or run an A/B test to get the answer you’re looking for.
Just remember to only test one element of a message at a time during an A/B test. Otherwise, you won’t know what change affected your results. It’s better to go slow and steady so you can collect the data you need to set yourself up for sustainable growth and long-term success.
Don’t adjust based on a hunch. You’ll need to be strategic with your data and the changes you make to keep moving in the right direction.
What can this look like for your nonprofit? Click here to chat with our team and find out!


